Designing a Distributed Tracing Backend: Dapper-Style Sampling and Storage
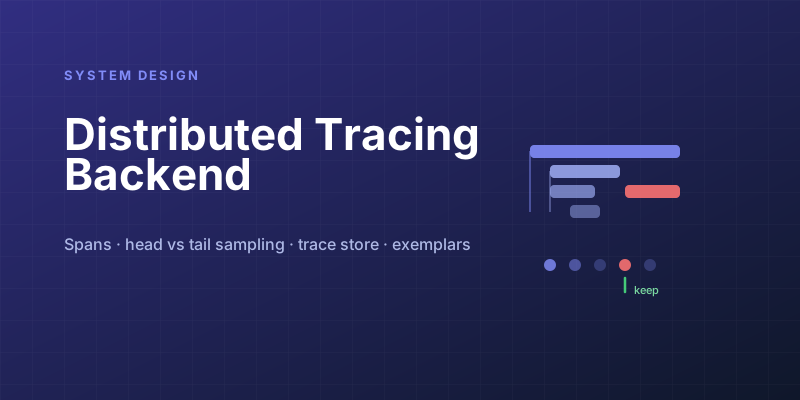
Here is the paradox at the heart of tracing: to observe a system that handles a million requests per second, you must build a pipeline that handles more than a million writes per second — every request generates several spans, each larger than the request's own log line. Trace everything and observability becomes your biggest workload. Google's Dapper paper resolved the paradox with an answer that still offends people the first time they hear it: throw almost everything away, deliberately.
The data model (30 seconds, then the hard parts)
A trace is a tree of spans; each span = {trace_id, span_id, parent_span_id, service, operation, start, duration, tags, events}. Context propagation — trace_id and parent_span_id riding along every RPC/queue hop (W3C traceparent header) — is a client-library problem and mostly solved by OpenTelemetry. The backend design starts where the SDK ends: an unbounded firehose of spans arriving out of order, and two very different read patterns waiting downstream.
Sampling: the defining decision
Head-based sampling (Dapper's choice): decide at the root span — keep 0.1% of traces, uniformly at random, decision propagated so a trace is complete-or-absent. Cheap (the discard happens at the source, unsampled requests pay ~nothing), unbiased for aggregate analysis — and it throws away exactly the traces you want most: the rare 500, the p99.9 straggler. At 0.1% sampling, a one-in-ten-thousand failure appears in your tracing UI once per ten million requests.
Tail-based sampling: buffer every span until its trace completes (or times out), then keep the interesting ones — errors, slow traces, rare endpoints. You keep the needles and drop the hay. The cost is the design problem: every span must flow to a buffer, held for seconds, and — the subtle part — all spans of one trace must reach the same buffering node (decisions need the full tree), so the collector tier does a shuffle keyed by trace_id, and now you have a stateful, memory-hungry streaming join in your telemetry path.
head:  SDK decides at root -> 99.9% never leave the process
tail:  all spans -> collectors --shuffle by trace_id--> buffers (~30s)
       -> policy: keep if error OR duration > p99 OR random 0.1%
Production answer: both. Head-sample a uniform baseline (unbiased stats), tail-sample on top for errors/latency (the interesting specimens), and let services force-sample (debug header). Adaptive rate control per (service, endpoint) keeps per-tenant volume within budget — sampling rates are a control loop, not a config constant.
Ingestion pipeline
Agent/sidecar batches spans → Kafka (buffer for consumer crashes and traffic spikes; observability pipelines must absorb correlated bursts, because incidents — the moments you need tracing — are precisely when span volume triples) → stream processors that do the tail-sampling shuffle, enrich (k8s metadata), and write to storage. Backpressure policy is worth stating: under overload, drop spans rather than slow applications — telemetry must never take down the system it watches. Every SDK ships a bounded queue with drop-on-full for this reason.
Storage: two shapes, two stores
The read patterns are irreconcilable in one layout, so mature systems store spans twice:
- Trace lookup ("show me trace X"): all spans for a trace_id, together. Wide-row store keyed by
trace_id(Cassandra/HBase/object storage blocks) — one seek returns the tree. TTL a few days-weeks; traces age out ruthlessly. - Search ("slow checkout requests with error=timeout, last hour"): inverted/columnar index over
(service, operation, duration, tags, time)→ matching trace_ids → fetch from store #1. This is the expensive store; index only the tag keys that queries actually use, or cardinality eats you. - (The third consumer is not a store: streaming aggregation of spans → RED metrics and service-dependency graphs. Half of tracing's org-wide value — the service map, the latency dashboards — comes from spans nobody ever reads individually.)
The queries that justify the whole system
A trace view answers "where did this request spend its time." The aggregate views answer the questions that change architecture: critical-path analysis (which service actually gates p99 — not the slowest service, the slowest path), dependency drift (who started calling whom), and exemplars (metrics histogram bucket → click → a real trace from that bucket, joining the two telemetry worlds). Design for the exemplar join early — it means metrics and traces must share resource attributes — or retrofit it painfully.
| Interview probe | Answer sketch |
|---|---|
| Why not trace 100%? | Ingest ≥ production traffic × span multiplier; cost scales with the system observed — sampling is the product, not a compromise |
| Incomplete traces? | Timeout the buffer, store partial trees flagged; async/queue hops carry links not parents |
| Clock skew across hosts? | Durations are per-host monotonic (trustworthy); alignment via parent-child causality, not wall clocks |
| Retention economics? | Hot indexed days, warm trace-store weeks, aggregates forever; the index is what you're paying for |
The transferable pattern: when observing X costs a function of X's own scale, the design space is what to discard and where. Head sampling discards early and blind; tail sampling discards late and informed; the price of being informed is a stateful shuffle. That sentence generalizes to logs and metrics too — which is why every observability pipeline eventually grows the same three-stage shape.
Keep reading
Designing a Metrics System: Time-Series Storage from Gorilla to Downsampling
Ten million series, one datapoint each per 10 seconds, queried by tags: delta-of-delta compression, the inverted index over labels, and why high cardinality kills TSDBs.
Designing Petabyte Log Search: Index Everything vs Grep Smarter
Logs are 100x your metrics volume and queried 0.001% as often. The Splunk-style full index, the Loki-style label-only bet, and bloom-filtered brute force in between.
GitHub Actions OIDC: Azure Login Without a Client Secret
Federated credentials replace AZURE_CLIENT_SECRET. Match issuer, audience, and the subject GitHub actually emits — environment jobs do not use the branch claim.
Kubernetes Liveness Probes That Restart a Process That Was Fine
Liveness restarts the container. Readiness pulls it out of the Service. A startup probe holds both off until the process has booted. Most outages come from using the wrong one.
GitHub Rewrote the Copilot Runtime in Rust With Agents. The Playbook Is the Story.
832,378 lines of production Rust, 128 pull requests, 135 releases in fourteen and a half weeks, about $120,000 in tokens. What GitHub's TypeScript-to-Rust port of the Copilot agent runtime teaches about shipping a rewrite without a cutover.
The Pipeline Was Green Because the Test Stage Never Ran
How an Azure DevOps condition and a skipped stage produce a green build that did not test anything, and the check to add so that cannot ship.
Newsletter
New posts, straight to your inbox
One email per post. No spam, no tracking pixels, unsubscribe anytime.
Comments
- No comments yet. Be the first.