Designing a Metrics System: Time-Series Storage from Gorilla to Downsampling
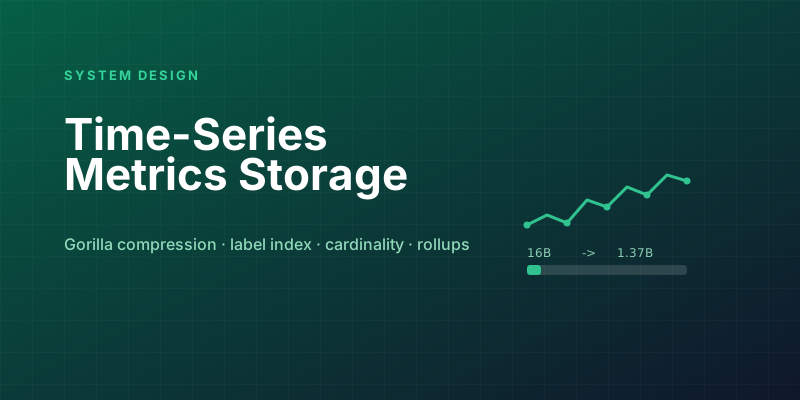
A metrics system ingests the most repetitive data in computing — the same counters, from the same hosts, every ten seconds, forever — and must answer ad-hoc questions over it in dashboard time. The repetitiveness is the gift: Facebook's Gorilla paper showed a datapoint that naively costs 16 bytes compresses to 1.37 bytes once you exploit how boring telemetry is. Designing a TSDB is the art of cashing in that boringness at every layer — and then surviving the one thing that isn't boring: cardinality.
The data model and the write shape
A series is a metric name plus a set of label key-values; datapoints are (timestamp, float64) appended to a series:
http_requests_total{service="checkout", region="us-east", status="500"} -> (t, v)
Write pattern: millions of series, each appending one point per scrape interval — tiny writes, enormous fan-in, essentially never updated, aged out by retention. Read pattern: "sum this metric across all series matching service=checkout, last 6 hours" — selects thousands of series by label, scans a time range of each. Every design decision serves those two shapes.
Gorilla compression: the famous part
Per-series, in arrival order. Timestamps: scrape intervals are nearly constant, so store delta-of-delta — the difference between successive deltas — which is almost always zero and Huffman-codes to a single bit. Values: successive floats are similar, so XOR with the previous value; identical → one bit, else the XOR has long runs of zeros — store just the meaningful window.
timestamps: 10:00:00, 10:00:10, 10:00:20, 10:00:30
deltas:            10,       10,       10      -> delta-of-delta: 0, 0 -> '0' bits
values:     512.0 -> 512.0 -> 514.0
            XOR=0 -> '0'    XOR=small window -> ~14 bits
~12× compression means the hot window (last day or two) of tens of millions of series fits in RAM — which is the actual point: Gorilla wasn't a storage optimization, it was a "serve every dashboard and alert from memory" design. On disk, the same idea persists as immutable 2-hour blocks (Prometheus's layout): compressed chunks per series + an index per block, with a WAL protecting the in-memory head block. Immutable blocks make retention (rm), replication (copy), and compaction (merge blocks, drop tombstones) embarrassingly simple — the LSM philosophy applied to telemetry.
The index: where TSDBs are actually won
Queries select series by label predicates, so beside the chunk store lives an inverted index: label=value → posting list of series IDs, with intersections for multi-label queries (service=checkout ∩ region=us-east), exactly like a search engine over tiny documents.
This index is why high cardinality is the death word in this domain. Every unique label combination is a new series: add user_id as a label on one metric and 10M users × 5 statuses × 20 endpoints explodes into a billion series — each costing index entries, head-block memory, and per-series chunk overhead, most receiving one datapoint ever (the "churn" variant: pod_name in Kubernetes rotating hourly). The system-level defenses: per-tenant series limits enforced at ingest (reject or drop-new, loudly), label allowlists/relabeling at the collection edge, and adaptive rollups. The design answer interviewers want: metrics are for bounded-cardinality aggregates; unbounded identifiers belong in logs or traces. A TSDB that "solves" unlimited cardinality has just become a worse logging system.
Downsampling and the query tier
Retention is tiered because nobody reads 10-second points from last March: raw at full resolution for days, then downsampled rollups — but a rollup must store the aggregate family (min, max, sum, count) per bucket, not the mean alone: means of means are wrong for re-aggregation (avg of avgs ≠ avg), and max/percentile queries need the components. Percentiles themselves force a choice — store histogram buckets (mergeable across series, approximate) rather than precomputed p99s (unmergeable). "You cannot average percentiles" is a one-line answer that signals real operational scars.
The query engine does the standard distributed-read dance: scatter to the shards owning matching series (shard by series hash for write balance; queries always fan out — the write/read sharding tension is inherent), stream per-series data through the aggregation, merge. Alert evaluation is the same query path on a timer with one extra property: it must degrade predictably — alerting reads get priority and reserved capacity, because the moment the metrics system is overloaded is exactly the moment alerts matter (same "observe the outage during the outage" constraint as tracing pipelines).
| Interview probe | Answer sketch |
|---|---|
| Why not Postgres/Cassandra with (series, ts) keys? | Generic engines can't exploit delta-of-delta/XOR or immutable-block retention; 10-50× worse storage and scan cost |
| Counter resets (process restart)? | Store raw counters, handle resets at query time (rate() detects decreases); never pre-compute rates at ingest |
| Out-of-order writes? | Reject beyond a small tolerance window (Gorilla's model), or pay for a reorder buffer (recent TSDBs) — state the trade |
| Global view across regions? | Federate queries across per-region TSDBs, or dual-write to a central long-term store (Thanos/Mimir shape: object storage + query-time merge) |
The through-line: a TSDB is three exploitations of boringness — compression (points resemble their predecessors), immutability (blocks age, never change), and bounded cardinality (aggregates, not identities) — and the third one is a contract with your users, not a property of the code.
Keep reading
Designing Petabyte Log Search: Index Everything vs Grep Smarter
Logs are 100x your metrics volume and queried 0.001% as often. The Splunk-style full index, the Loki-style label-only bet, and bloom-filtered brute force in between.
Designing a Distributed Tracing Backend: Dapper-Style Sampling and Storage
Tracing every request would need a system bigger than the one being traced. Head vs tail sampling, span ingestion pipelines, and storage laid out for trace reads.
GitHub Actions OIDC: Azure Login Without a Client Secret
Federated credentials replace AZURE_CLIENT_SECRET. Match issuer, audience, and the subject GitHub actually emits — environment jobs do not use the branch claim.
Kubernetes Liveness Probes That Restart a Process That Was Fine
Liveness restarts the container. Readiness pulls it out of the Service. A startup probe holds both off until the process has booted. Most outages come from using the wrong one.
GitHub Rewrote the Copilot Runtime in Rust With Agents. The Playbook Is the Story.
832,378 lines of production Rust, 128 pull requests, 135 releases in fourteen and a half weeks, about $120,000 in tokens. What GitHub's TypeScript-to-Rust port of the Copilot agent runtime teaches about shipping a rewrite without a cutover.

The Pipeline Was Green Because the Test Stage Never Ran
How an Azure DevOps condition and a skipped stage produce a green build that did not test anything, and the check to add so that cannot ship.
Newsletter
New posts, straight to your inbox
One email per post. No spam, no tracking pixels, unsubscribe anytime.
Comments
- No comments yet. Be the first.