Kubernetes Liveness Probes That Restart a Process That Was Fine
A probe is a yes or no question, and Kubernetes does a different thing with each answer. Mixing the questions up is how a database blip restarts every pod, or how a slow boot gets killed for not answering /healthz in the first second.
Three probes, three outcomes
| Probe | If it fails | What it is for |
|---|---|---|
| Liveness | The kubelet restarts the container | The process is wedged, and a restart can help |
| Readiness | The pod is removed from Service endpoints. The process keeps running | The process should not receive traffic right now |
| Startup | Liveness and readiness do not run until this succeeds. Enough failures and the container is restarted | Slow boot that would otherwise look dead |
Liveness that checks the database is the common mistake. The database stops answering, every pod fails liveness, every pod restarts, and the database gets a reconnect storm from the thing you were trying to protect. A restart does not fix a down dependency. Readiness does: traffic stops, the process stays up, and it can pass again when the dependency returns.
Liveness is for deadlock. A handler that returns failure only when the process cannot make progress on its own, with no network call in that path. Readiness is allowed to touch a dependency, and it is allowed to flap.
Slow starts need a startup probe, not a long initial delay
initialDelaySeconds waits a fixed time and then liveness is live. If boot sometimes takes longer than that delay, the kubelet kills a process that was still starting. A startup probe disables liveness and readiness until it succeeds once. Kubernetes' own example is failureThreshold: 30 and periodSeconds: 10, which is five minutes of budget, after which liveness takes over and can still react quickly.
startupProbe:
  httpGet:
    path: /healthz
    port: 8080
  failureThreshold: 30
  periodSeconds: 10
livenessProbe:
  httpGet:
    path: /healthz
    port: 8080
  periodSeconds: 10
  failureThreshold: 3
readinessProbe:
  httpGet:
    path: /ready
    port: 8080
  periodSeconds: 5
  failureThreshold: 2
timeoutSeconds defaults to 1. A health handler that queries three services will exceed that and look dead. successThreshold must be 1 for liveness and startup. An exec probe forks a process in the container on every tick. httpGet against a local port is the cheaper check. Use a different path for liveness and readiness when the answers are different. One handler that does both jobs will be configured to the stricter of the two, and you are back to restarting on a dependency.
What the restart loop looks like in the alert
A pod that is not ready should page only if it stays that way, or if too many pods in the Service are unready to serve. A pod that is crash-looping is a liveness or startup failure, and it is a different page. Those are the alerts worth having; the rest is in alerts that don't cry wolf. If the liveness path contains a dependency, fix the probe before you tune the alert. The alert is reporting the restart you asked for.
Keep reading
GitHub Rewrote the Copilot Runtime in Rust With Agents. The Playbook Is the Story.
832,378 lines of production Rust, 128 pull requests, 135 releases in fourteen and a half weeks, about $120,000 in tokens. What GitHub's TypeScript-to-Rust port of the Copilot agent runtime teaches about shipping a rewrite without a cutover.

The Pipeline Was Green Because the Test Stage Never Ran
How an Azure DevOps condition and a skipped stage produce a green build that did not test anything, and the check to add so that cannot ship.
GitHub Merge Queues: Serializing main Without Parking Every PR
How merge queues absorb the rebase race on protected branches, what CI has to guarantee, and when a queue is worse than Require branches to be up to date.
Designing a Metrics System: Time-Series Storage from Gorilla to Downsampling
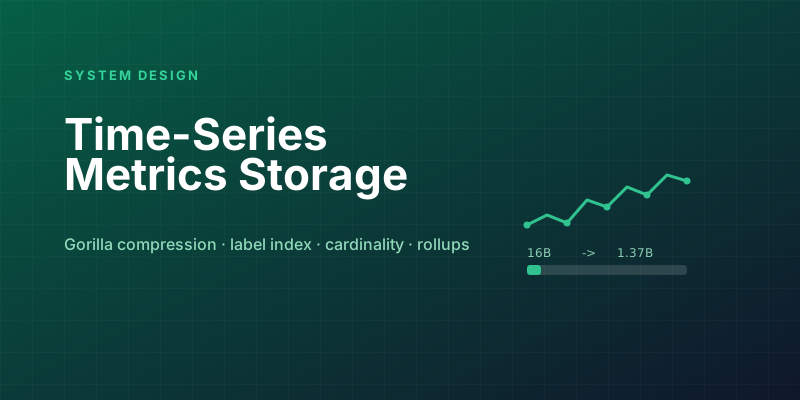
Ten million series, one datapoint each per 10 seconds, queried by tags: delta-of-delta compression, the inverted index over labels, and why high cardinality kills TSDBs.
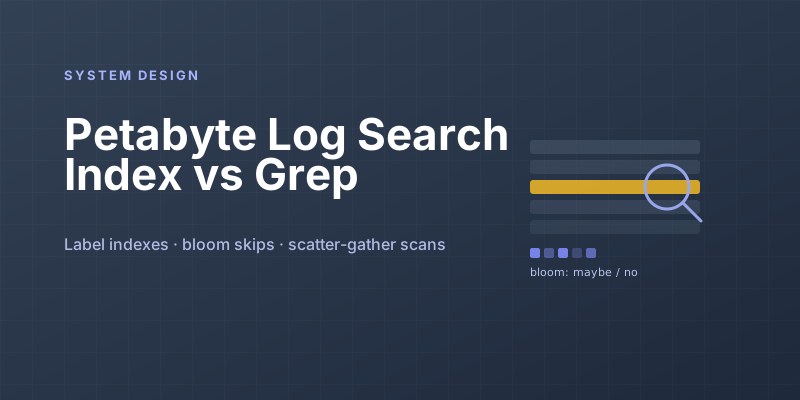
Designing Petabyte Log Search: Index Everything vs Grep Smarter
Logs are 100x your metrics volume and queried 0.001% as often. The Splunk-style full index, the Loki-style label-only bet, and bloom-filtered brute force in between.
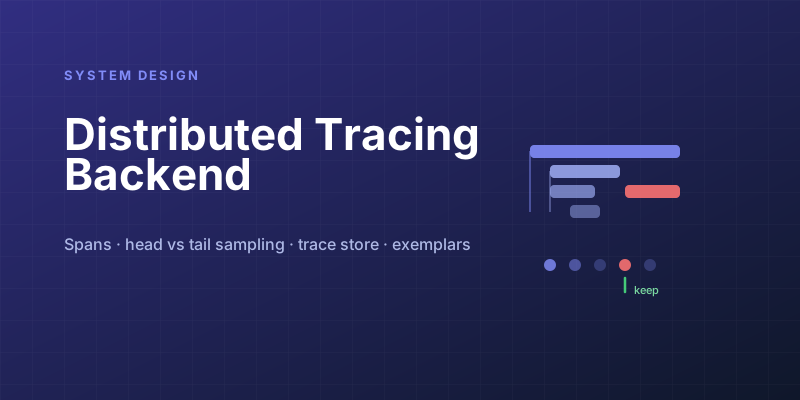
Designing a Distributed Tracing Backend: Dapper-Style Sampling and Storage
Tracing every request would need a system bigger than the one being traced. Head vs tail sampling, span ingestion pipelines, and storage laid out for trace reads.
Newsletter
New posts, straight to your inbox
One email per post. No spam, no tracking pixels, unsubscribe anytime.
Comments
- No comments yet. Be the first.